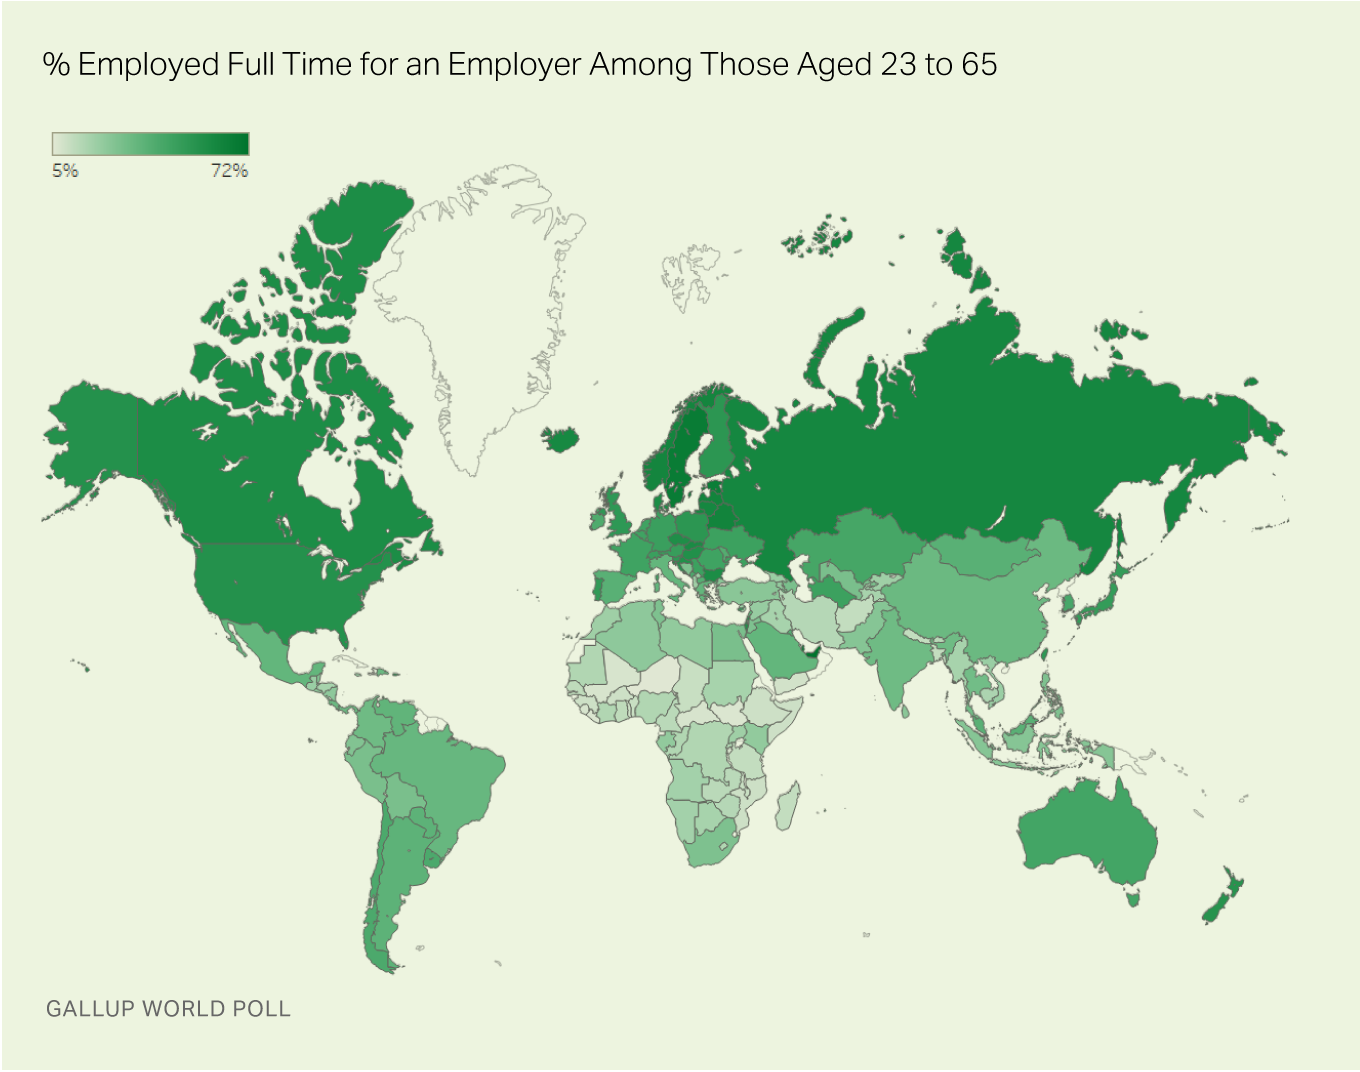
The percentage of a country's population that is employed full time for an employer -- which Gallup refers to as having a "good job" -- is one of the most fundamental statistics of productivity, the engine that drives both economic growth and development. The world desperately needs more jobs like these that give people a measure of security and allow them to plan for the long term rather than eke out a living in subsistence-level jobs.
Gallup's new State of the Global Workplace report, which features a wealth of recent data on the workforces around the world, shows that across 155 countries, 32% of adults between the ages of 23 and 65 have these good jobs. However, this figure varies widely from country to country, ranging from a low of 5% in Niger to a high of 72% in the United Arab Emirates.

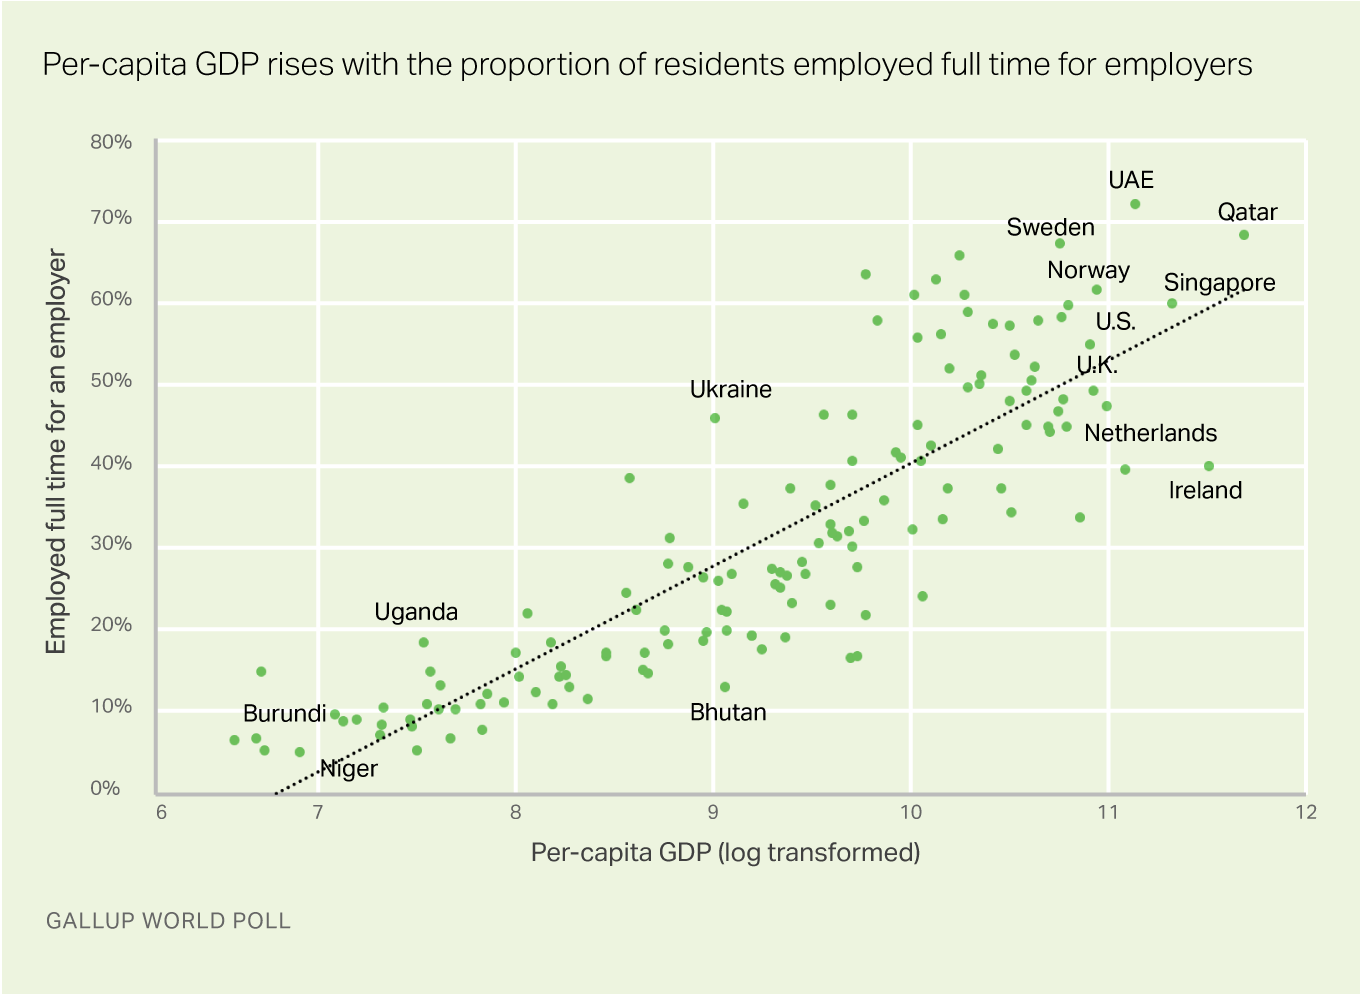
This relatively simple measure is a useful barometer of social and economic conditions in a country. To begin with, it's a good indicator of economic development. Formal employment opportunities are more common and diversified in more developed countries than in less developed ones. That's because human capital -- the skills, knowledge and talents within a population -- is more fully developed and used more efficiently in areas with many employers of different sizes and in different industries.
Consequently, countries with higher levels of gross domestic product (GDP) per capita -- or productivity -- also have more residents who are employed full time for employers.

Beyond sheer productivity, Gallup's "good jobs" measure gauges economic inclusiveness. Comparing the results for working-age men and women, for example, offers a look at how traditional gender roles may affect levels of full-time employment. Globally, working-age men are almost twice as likely as women to work full time for employers -- 42% vs. 23%, respectively. But the gender gaps are widest in South Asia and the Middle East and North Africa region, where low percentages of women with good jobs depress the total number of residents employed full time for an employer.
| Total | Men | Women | Gender gap | ||||||||||||||||||||||||||||||||||||||||||||||||||||||||||||||||||||||||||||||||||||||||||||||||
|---|---|---|---|---|---|---|---|---|---|---|---|---|---|---|---|---|---|---|---|---|---|---|---|---|---|---|---|---|---|---|---|---|---|---|---|---|---|---|---|---|---|---|---|---|---|---|---|---|---|---|---|---|---|---|---|---|---|---|---|---|---|---|---|---|---|---|---|---|---|---|---|---|---|---|---|---|---|---|---|---|---|---|---|---|---|---|---|---|---|---|---|---|---|---|---|---|---|---|---|
| % | % | % | pct. pts. | ||||||||||||||||||||||||||||||||||||||||||||||||||||||||||||||||||||||||||||||||||||||||||||||||
| World (155 countries and areas) | 32 | 42 | 23 | 19 | |||||||||||||||||||||||||||||||||||||||||||||||||||||||||||||||||||||||||||||||||||||||||||||||
| South Asia | 28 | 43 | 14 | 29 | |||||||||||||||||||||||||||||||||||||||||||||||||||||||||||||||||||||||||||||||||||||||||||||||
| Middle East/North Africa | 24 | 37 | 10 | 27 | |||||||||||||||||||||||||||||||||||||||||||||||||||||||||||||||||||||||||||||||||||||||||||||||
| Latin America | 32 | 43 | 22 | 21 | |||||||||||||||||||||||||||||||||||||||||||||||||||||||||||||||||||||||||||||||||||||||||||||||
| Australia/New Zealand | 46 | 56 | 38 | 18 | |||||||||||||||||||||||||||||||||||||||||||||||||||||||||||||||||||||||||||||||||||||||||||||||
| Southeast Asia | 25 | 35 | 17 | 18 | |||||||||||||||||||||||||||||||||||||||||||||||||||||||||||||||||||||||||||||||||||||||||||||||
| U.S./Canada | 56 | 64 | 48 | 16 | |||||||||||||||||||||||||||||||||||||||||||||||||||||||||||||||||||||||||||||||||||||||||||||||
| Post-Soviet States | 50 | 58 | 44 | 14 | |||||||||||||||||||||||||||||||||||||||||||||||||||||||||||||||||||||||||||||||||||||||||||||||
| East Asia | 34 | 40 | 27 | 13 | |||||||||||||||||||||||||||||||||||||||||||||||||||||||||||||||||||||||||||||||||||||||||||||||
| Eastern Europe | 49 | 55 | 43 | 12 | |||||||||||||||||||||||||||||||||||||||||||||||||||||||||||||||||||||||||||||||||||||||||||||||
| Western Europe | 45 | 51 | 39 | 12 | |||||||||||||||||||||||||||||||||||||||||||||||||||||||||||||||||||||||||||||||||||||||||||||||
| Sub-Saharan Africa | 14 | 19 | 9 | 10 | |||||||||||||||||||||||||||||||||||||||||||||||||||||||||||||||||||||||||||||||||||||||||||||||
| *Within each region, results are weighted proportionally by population size in each country. | |||||||||||||||||||||||||||||||||||||||||||||||||||||||||||||||||||||||||||||||||||||||||||||||||||
| Gallup World Poll | |||||||||||||||||||||||||||||||||||||||||||||||||||||||||||||||||||||||||||||||||||||||||||||||||||
Large gender gaps in full-time employment are particularly common in countries in the Middle East and North Africa, where societal pressures limit women's labor force participation. In many of these, however, public opinion is at odds with such restrictions. A 2016 study on women and work by Gallup and the International Labour Organization (ILO) found that 57% of men and 67% of women in Arab States feel it is acceptable for women in their families to have paid jobs outside the home.
Women in other countries around the world feel these pressures as well. In Japan, two-thirds of working-age men (67%) work full time for an employer vs. slightly more than one-third of women (35%). Businesses in Japan often demand that workers prioritize their employers over their personal lives. Women's traditional roles as mothers and homemakers make it particularly difficult to compete with men under such demanding conditions.
In a few countries, the labor market has adapted to make women's lower "good jobs" rate less problematic. The Netherlands, which has one of the largest gender gaps in the world, is one example. One in four working-age Dutch women work full time for employers, vs. 65% of men. However, 32% of working-age women in the Netherlands work part time by choice, the highest proportion of any country in the world. As in other places, traditional gender roles account for women's lower likelihood to have full-time jobs -- but Dutch society has compensated, at least in part, by focusing on the development of high-quality part-time jobs that help women maintain a high labor force participation rate while fulfilling child-care responsibilities.
Implications
As the Dutch case demonstrates, in some cases the need for productivity can be balanced with family-supportive policies that maximize well-being among a country's residents. Such efforts demonstrate that promoting job growth, particularly in countries where it is most desperately needed, requires a coordinated effort by societal and business leaders.
-
Political leaders must work to ensure their country's institutional infrastructure supports the development of human capital -- most importantly, by providing equitable education opportunities that align with the country's labor market needs and promote adaptability amid rapid technological changes.
-
Employers, especially those in the private sector, must ensure that they are prepared to make the most of the resulting human capital by creating workplace cultures that drive performance development and allow individuals to make the best use of their time and talents.
Leaders who work together on conditions that maximize productivity and resilience along the education-employment spectrum offer the best hope for the job growth that many countries need to escape economic stagnation.
- Learn about global trends in human development and engagement by attending our webinar.
- Download the State of the Global Workplace report.


