GALLUP NEWS SERVICE
PRINCETON, NJ -- Americans are robust news consumers, but, with the growth of the Internet and 24-hour cable television news over the past decade, traditional media outlets have been struggling to hold their market share. Gallup trends, based on self-reports of media use patterns, confirm that local newspaper readership has dipped in recent years and the once considerable nightly network television news audience has shrunk considerably. However, the latest update, from December 2006, is not all bad news for these outlets. The rapid growth in the Internet news audience may have slowed in the last two years, and cable news viewership has declined. Through it all, local television news has captured a daily audience that includes slightly more than half of Americans, making it the No. 1 source of news in recent years.
In its annual Lifestyle survey, conducted Dec. 11-14, Gallup asked Americans to report the frequency with which they get their news from each of 13 media sources, spanning television, radio, print, and the Internet. In general, local outlets beat national ones; and within these categories, broadcast news beats print. Radio news still attracts a much smaller number of daily listeners than does television or newspapers, and is about on par with daily Internet news readers or viewers.
The Full Rankings
|
|
|
Several
|
|
% |
% |
|
|
Local television news from TV stations in your area |
55 |
14 |
|
Local newspapers in your area |
44 |
13 |
|
Nightly network news programs on ABC, CBS or NBC |
35 |
16 |
|
Cable news networks such as CNN, Fox News Channel and MSNBC |
34 |
16 |
|
Public television news |
28 |
12 |
|
Morning news and interview programs on the national TV networks |
28 |
11 |
|
News on the Internet |
22 |
11 |
|
Radio talk shows |
20 |
9 |
|
National Public Radio (NPR) |
19 |
8 |
|
National newspapers such as the New York Times, Wall Street Journal, USA Today |
7 |
6 |
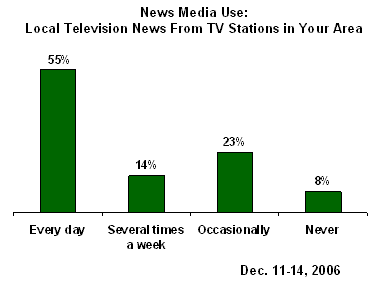
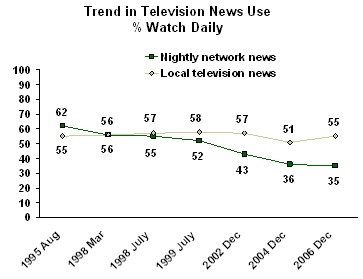
Fifty-five percent of Americans today say they watch local television news daily, which is the same as when Gallup first measured this in 1995. An additional 14% say they watch it several times a week, enlarging the total group of frequent viewers to 69%. About a quarter watch occasionally, leaving only 8% who never watch.
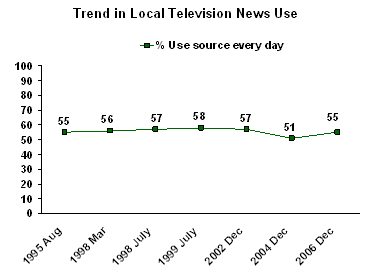
The percentage of daily local TV news viewers, at 55% today, has been fairly steady for the past decade.
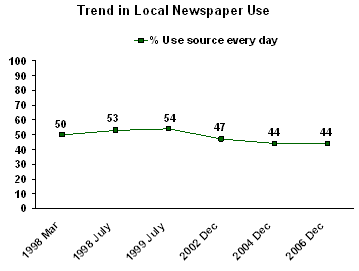
The next most common source of news is local newspapers, which 44% of Americans say they read daily, and another 13% say several times a week -- yielding a majority (57%) in the frequent reader category. The number of daily readers today is about 10 percentage points lower than where this stood in the late 1990s.
The nightly network news and cable news networks are about tied for third place, with daily viewership of 34% to 35% and total frequent viewership of about 50%. The two media sources have been about even on this measure since 2002, with both showing a decline in the percentage of daily viewers.
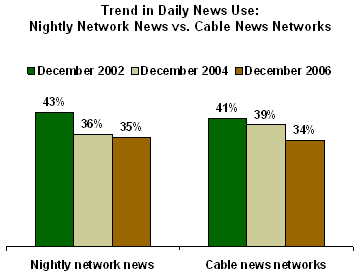
Gallup's long-term trend on nightly network news watching shows an even steeper decline. In 1995, Gallup found 62% of Americans reporting daily viewership -- the highest of any media outlet rated that year, including local television news. This fell to 55% by 1998 (on par with local television news), to 43% by 2002 (well below local television news), and to 36% by 2004, which is about where it stands today.
The morning network news shows and public television news are each watched daily by 28% of Americans, and frequently by roughly 40%. Neither of these has shown much change in recent years.
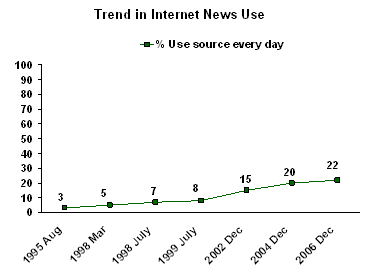
Slightly fewer Americans (22%) turn to the Internet every day for news, which expands to a third when counting those surfing for news at least several times a week. This is just slightly higher than the 27% who tune in frequently (including 19% daily) to National Public Radio.
Gallup documented an increase in Internet news consumption from 1995 through 2004, but that growth may have slowed more recently. Between 2002 and 2004, the number of daily Internet news consumers increased by five percentage points (from 15% to 20%); but in the most recent two years it increased by only two points (from 20% to 22%).
Talk radio expanded its reach from about 12% of daily listeners in the late 1990s to 22% in 2002. However, it remains at about that level today. An additional 9% of Americans say they listen to radio talk shows several times a week.
Only 7% of Americans say they read a national newspaper (such as USA Today or The New York Times) every day. An additional 6% read these several times a week. These figures haven't changed much over the past several years. It's possible that the reach of these publications (as well as larger local and regional newspapers) is augmented by online readership, something not measured in the current poll.
Gallup also asked Americans about their attention to three news sources that are weekly in nature, rather than daily. Of these, the greatest number, 20%, tunes in every week to TV newsmagazine shows during the evenings -- to programs like 60 Minutes, 20/20, and Dateline. About the same percentage (19%) regularly watches the Sunday morning television news programs. Far fewer, only 12%, say they read a weekly newsmagazine every week.
|
|
|
Several
|
|
% |
% |
|
|
TV news magazine shows during the evenings -- such as 60 Minutes, 20/20, Dateline |
20 |
12 |
|
Television news programs on Sunday mornings |
19 |
5 |
|
Weekly newsmagazines |
12 |
6 |
Demographic Differences
There are several important patterns in Gallup's media use data. One is that women are consistently more likely than men to be daily viewers of television news. That holds true for the nightly network news and public television news as well as local TV news and the morning network news shows. Only when it comes to cable news are women not ahead of men in viewership.
Men are more likely than women to be daily consumers of news on the Internet as well as talk radio. Men and women are about equal in their use of the major print news sources, including local and national newspapers, and weekly newsmagazines.
|
News Consumption by Gender
|
|||
|
Men |
Women |
Difference
|
|
|
% |
% |
|
|
|
Nightly network news |
28 |
40 |
+12 |
|
Local TV news |
49 |
60 |
+11 |
|
TV newsmagazine shows^ |
15 |
24 |
+9 |
|
Morning network news shows |
24 |
32 |
+8 |
|
Public television news |
25 |
32 |
+7 |
|
Sunday morning news programs^ |
16 |
22 |
+6 |
|
Cable news networks |
36 |
32 |
-4 |
|
Radio talk shows |
23 |
16 |
-7 |
|
News on the Internet |
26 |
18 |
-8 |
|
^Read/watch weekly |
|||
Secondly, Gallup sees sharp, albeit predictable, distinctions in news consumption by age, with those aged 18 to 49 less likely to report using every news source tested, with one exception. Those under 50 are much less likely to be daily newspaper and magazine readers or television viewers than those 50 and older. The differences are especially large for the nightly network news, local newspaper,and local television news. The age differences are minimal for NPR and radio talk shows. The exception to this pattern of higher use of news sources among those 50 and older is the Internet. Young adults are nearly twice as likely as those 50 and older to get a daily dose of news from the Internet.
|
News Consumption by Age
|
|||
|
18-49 |
50+ |
Difference
|
|
|
% |
% |
|
|
|
Nightly network news |
22 |
49 |
+27 |
|
Local newspapers |
33 |
57 |
+24 |
|
Local TV news |
46 |
66 |
+20 |
|
Cable news networks |
27 |
42 |
+15 |
|
Public television news |
21 |
36 |
+15 |
|
Sunday morning news programs^ |
13 |
27 |
+14 |
|
TV evening newsmagazines^ |
14 |
26 |
+12 |
|
Morning network news shows |
24 |
33 |
+9 |
|
National newspapers |
5 |
11 |
+6 |
|
Weekly newsmagazines^ |
9 |
15 |
+6 |
|
National Public Radio |
17 |
20 |
+3 |
|
Radio talk shows |
19 |
20 |
+1 |
|
News on the Internet |
28 |
15 |
-13 |
|
^ Read/watch weekly |
|||
Gallup finds some differences in use of most news media sources according to political party affiliation. A fairly large difference (18 points) is seen with respect to the nightly network news, watched daily by 43% of Democrats, compared with only 25% of Republicans. Democrats are also a bit more likely than Republicans to watch local television news daily (63% vs. 53%) and public television news (33% vs. 26%), as well as the morning network news programs (35% vs. 24%). Republicans, on the other hand, are more likely to get news from the Internet (29% vs. 18%). More Republicans than Democrats listen daily to talk radio (25% vs. 17%), while more Democrats than Republicans listen daily to NPR (23% vs. 14%).
Survey Methods
Results are based on telephone interviews with 1,010 national adults, aged 18 and older, conducted Dec. 11-14, 2006. For results based on the total sample of national adults, one can say with 95% confidence that the maximum margin of sampling error is ±3 percentage points. In addition to sampling error, question wording and practical difficulties in conducting surveys can introduce error or bias into the findings of public opinion polls.
Now thinking about the news media,
17. Please indicate how often you get your news from each of the following sources -- every day, several times a week, occasionally, or never. How about -- [RANDOM ORDER]?
Full Results and Trends:
A. Local newspapers in your area
|
|
Several times
|
|
|
|
|
|
% |
% |
% |
% |
% |
|
|
2006 Dec 11-14 |
44 |
13 |
28 |
14 |
* |
|
|
|
|
|
|
|
|
2004 Dec 5-8 |
44 |
14 |
27 |
15 |
* |
|
2002 Dec 5-8 |
47 |
13 |
26 |
14 |
* |
|
1999 Jul 22-25 |
54 |
14 |
21 |
10 |
1 |
|
1998 Jul 13-14 |
53 |
15 |
22 |
10 |
-- |
|
1998 Mar 6-9 ^ |
50 |
12 |
26 |
11 |
1 |
|
|
|
|
|
|
|
|
^Asked of a half sample |
|||||
B. National newspapers such as The New York Times, the Wall Street Journal and USA Today
|
|
Several times
|
|
|
|
|
|
% |
% |
% |
% |
% |
|
|
2006 Dec 11-14 |
7 |
6 |
23 |
62 |
* |
|
|
|
|
|
|
|
|
2004 Dec 5-8 |
7 |
4 |
27 |
62 |
* |
|
2002 Dec 5-8 |
11 |
5 |
26 |
58 |
-- |
|
1999 Jul 22-25 |
9 |
7 |
30 |
54 |
* |
|
1998 Jul 13-14 |
4 |
11 |
26 |
59 |
-- |
|
1998 Mar 6-9 ^ |
8 |
6 |
28 |
57 |
1 |
|
|
|
|
|
|
|
|
^Asked of a half sample |
|||||
C. Nightly network news programs on ABC, CBS or NBC
|
|
Several times
|
|
|
|
|
|
% |
% |
% |
% |
% |
|
|
2006 Dec 11-14 |
35 |
16 |
30 |
19 |
-- |
|
|
|
|
|
|
|
|
2004 Dec 5-8 |
36 |
16 |
26 |
22 |
* |
|
2002 Dec 5-8 |
43 |
16 |
25 |
15 |
1 |
|
1999 Jul 22-25 |
52 |
18 |
22 |
8 |
-- |
|
1998 Jul 13-14 |
55 |
19 |
19 |
7 |
* |
|
1998 Mar 6-9 |
56 |
19 |
17 |
7 |
1 |
|
1995 Aug 11-14 |
62 |
20 |
15 |
3 |
* |
D. Morning news and interview programs on the national TV networks
|
|
Several times
|
|
|
|
|
|
% |
% |
% |
% |
% |
|
|
2006 Dec 11-14 |
28 |
11 |
26 |
35 |
* |
|
|
|
|
|
|
|
|
2004 Dec 5-8 |
27 |
12 |
25 |
36 |
* |
|
2002 Dec 5-8 |
29 |
10 |
26 |
34 |
1 |
|
1999 Jul 22-25 |
32 |
11 |
29 |
28 |
* |
|
1998 Jul 13-14 |
25 |
13 |
27 |
35 |
* |
|
1998 Mar 6-9 |
25 |
13 |
24 |
37 |
1 |
|
1995 Aug 11-14 |
23 |
13 |
34 |
30 |
-- |
E. Cable news networks such as CNN, Fox News Channel and MSNBC
|
|
Several times
|
|
|
|
|
|
% |
% |
% |
% |
% |
|
|
2006 Dec 11-14 |
34 |
16 |
30 |
20 |
* |
|
|
|
|
|
|
|
|
2004 Dec 5-8 |
39 |
16 |
25 |
20 |
* |
|
2002 Dec 5-8 |
41 |
15 |
26 |
18 |
* |
F. Public television news
|
|
Several times
|
|
|
|
|
|
% |
% |
% |
% |
% |
|
|
2006 Dec 11-14 |
28 |
12 |
30 |
30 |
* |
|
|
|
|
|
|
|
|
2004 Dec 5-8 |
27 |
11 |
28 |
33 |
1 |
|
2002 Dec 5-8 |
35 |
12 |
29 |
24 |
* |
|
1999 Jul 22-25 |
30 |
12 |
33 |
24 |
1 |
G. Local television news from TV stations in your area
|
|
Several times a week |
|
|
|
|
|
% |
% |
% |
% |
% |
|
|
2006 Dec 11-14 |
55 |
14 |
23 |
8 |
* |
|
|
|
|
|
|
|
|
2004 Dec 5-8 |
51 |
19 |
19 |
11 |
* |
|
2002 Dec 5-8 |
57 |
16 |
18 |
9 |
* |
|
1999 Jul 22-25 |
58 |
14 |
19 |
9 |
* |
|
1998 Jul 13-14 |
57 |
15 |
19 |
9 |
* |
|
1998 Mar 6-9 |
56 |
17 |
17 |
9 |
1 |
|
1995 Aug 11-14 |
55 |
18 |
20 |
7 |
-- |
H. National Public Radio
|
|
Several times
|
|
|
|
|
|
% |
% |
% |
% |
% |
|
|
2006 Dec 11-14 |
19 |
8 |
28 |
45 |
* |
|
|
|
|
|
|
|
|
2004 Dec 5-8 |
17 |
12 |
25 |
46 |
* |
|
2002 Dec 5-8 |
22 |
9 |
28 |
40 |
1 |
|
1999 Jul 22-25 |
17 |
10 |
32 |
41 |
* |
|
1998 Jul 13-14 |
15 |
12 |
25 |
47 |
1 |
|
1998 Mar 6-9 |
20 |
10 |
26 |
43 |
1 |
|
1995 Aug 11-14 |
18 |
11 |
36 |
35 |
-- |
I. Radio talk shows
|
|
Several times
|
|
|
|
|
|
% |
% |
% |
% |
% |
|
|
2006 Dec 11-14 |
20 |
9 |
27 |
44 |
* |
|
|
|
|
|
|
|
|
2004 Dec 5-8 |
21 |
12 |
25 |
42 |
-- |
|
2002 Dec 5-8 |
22 |
10 |
29 |
39 |
* |
|
1999 Jul 22-25 |
12 |
8 |
33 |
47 |
* |
|
1998 Jul 13-14 |
12 |
9 |
21 |
58 |
* |
|
1998 Mar 6-9 |
11 |
5 |
25 |
58 |
1 |
|
1995 Aug 11-14 |
12 |
5 |
35 |
48 |
-- |
J. News on the Internet
|
|
Several times
|
|
|
|
|
|
% |
% |
% |
% |
% |
|
|
2006 Dec 11-14 |
22 |
11 |
24 |
43 |
* |
|
|
|
|
|
|
|
|
2004 Dec 5-8 |
20 |
6 |
25 |
49 |
* |
|
2002 Dec 5-8 |
15 |
8 |
27 |
50 |
* |
|
1999 Jul 22-25 ^ |
8 |
7 |
23 |
62 |
* |
|
1998 Jul 13-14 ^ |
7 |
6 |
17 |
70 |
* |
|
1998 Mar 6-9 ^ |
5 |
6 |
18 |
70 |
1 |
|
1995 Aug 11-14 ^ |
3 |
3 |
12 |
82 |
0 |
|
|
|
|
|
|
|
|
^WORDING: News on the computer using the Internet or an on-line computer service |
|||||
18. And how often do you get your news from each of the following WEEKLY sources of news: every week, several times a month, occasionally, or never. How about -- [ITEMS READ IN ORDER]?
Full Results and Trends:
A. Weekly newsmagazines
|
|
|
Several
|
|
|
|
|
% |
% |
% |
% |
% |
|
|
2006 Dec 11-14 |
12 |
6 |
18 |
64 |
* |
|
|
|
|
|
|
|
|
2004 Dec 5-8 |
11 |
4 |
21 |
64 |
* |
|
2002 Dec 5-8 |
12 |
5 |
20 |
63 |
* |
|
1998 Jul 13-14 |
15 |
6 |
27 |
52 |
-- |
|
1998 Mar 6-9 |
13 |
6 |
26 |
54 |
1 |
|
1995 Aug 11-14 |
14 |
5 |
30 |
51 |
-- |
B. Television news programs on Sunday mornings
|
|
|
Several times
|
|
|
|
|
% |
% |
% |
% |
% |
|
|
2006 Dec 11-14 |
19 |
5 |
26 |
50 |
* |
|
|
|
|
|
|
|
|
2004 Dec 5-8 |
18 |
7 |
22 |
53 |
* |
|
2002 Dec 5-8 |
18 |
5 |
25 |
52 |
* |
|
1998 Jul 13-14 |
17 |
6 |
27 |
50 |
-- |
|
1998 Mar 6-9 |
18 |
5 |
27 |
49 |
1 |
|
1995 Aug 11-14 |
16 |
5 |
32 |
47 |
-- |
C. TV newsmagazine shows during the evenings -- such as 60 Minutes, 20/20, Dateline, and others
|
|
|
Several
|
|
|
|
|
% |
% |
% |
% |
% |
|
|
2006 Dec 11-14 |
20 |
12 |
45 |
23 |
* |
|
|
|
|
|
|
|
|
2004 Dec 5-8 |
19 |
11 |
44 |
26 |
* |
|
2002 Dec 5-8 |
23 |
12 |
45 |
20 |
-- |
|
1998 Jul 13-14 ^ |
30 |
14 |
42 |
14 |
* |
|
1998 Mar 6-9 ^ |
30 |
15 |
42 |
12 |
1 |
|
1995 Aug 11-14 ^ |
33 |
15 |
43 |
9 |
-- |
|
|
|
|
|
|
|
|
^WORDING: TV newsmagazine shows during the evening, such as 60 Minutes, 20/20, Prime Time Live, Dateline, and others |
|||||
