GALLUP NEWS SERVICE
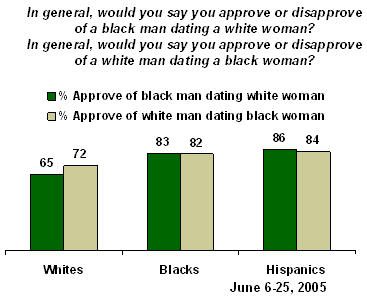
PRINCETON, NJ -- Most Americans say they approve of interracial dating. Even though a majority of whites approve, they are somewhat less likely to approve of interracial dating than are blacks or Hispanics. Interracial and interethnic dating is not uncommon in the United States, according to self-reports in the survey. Slightly less than half of Americans say they have dated someone from a different racial or ethnic background, with Hispanics more likely than whites or blacks to say this. Younger Americans are much more likely to approve of interracial dating and to have dated someone from a different racial or ethnic background.
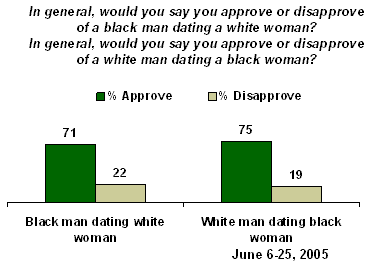
Gallup's annual Minority Rights and Relations poll delved into the topic of interracial dating to see whether Americans approve or disapprove of whites and blacks dating. One half of the sample, which included larger numbers of blacks and Hispanics than in a typical poll, was asked about a black man dating a white woman. The other half was asked about a white man dating a black woman. The poll finds 75% of Americans approving of a white man dating a black woman, and 71% approving of a black man dating a white woman. The difference is not statistically significant.

The distinction between the race of the man and woman makes little difference for blacks and Hispanics, but appears to affect whites' approval of interracial dating to a small degree. Seventy-two percent of whites approve of a white man dating a black woman, while 65% of whites approve of a black man dating a white woman.

There are substantial differences by age in approval of interracial dating. Those in the 18- to 29-year-old age category are nearly unanimous in their approval, but approval declines significantly with each succeeding age category, to the point at which less than half of senior citizens approve.
Percentage Approving of Interracial Dating, by Age
|
18 to 29 yrs |
30 to 49 yrs |
50 to 64 yrs |
65 yrs+ |
|
|
|
|
|
|
|
|
Black man dating white woman |
95% |
77 |
61 |
45 |
|
White man dating black woman |
95% |
85 |
64 |
46 |
Interracial and Interethnic Dating in Practice
In addition to measuring the public's attitudes toward interracial dating, the poll also measured the extent to which people have dated someone with similar or different racial and ethnic backgrounds from their own.
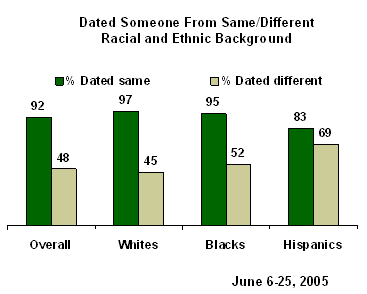
As one would expect, most Americans, 92%, say they have dated someone of their own racial or ethnic background in their lifetimes -- 97% of whites have dated a white person, 95% of blacks have dated a black person, and 83% of Hispanics have dated another Hispanic. But it is not uncommon for people to report dating someone from a different racial or ethnic background -- 48% of Americans overall say they have done so, including 69% of Hispanics, 52% of blacks, and 45% of whites.

Younger Americans -- who are more approving of interracial dating -- are also more likely to have dated a person from a different racial or ethnic background. Sixty percent of 18- to 29-year-olds have done so, compared with 53% of 30- to 49-year-olds, 46% of 50- to 64-year-olds, and only 28% of those 65 and older.
There are no appreciable gender differences in the incidence of dating someone from one's own race or ethnic background. However, there are differences by gender when it comes to dating someone from a different racial or ethnic background.
Black men (64%) are significantly more likely to say they have dated a nonblack than are black women (42%). Hispanic men (74%) are also more likely than Hispanic women (65%) to say they have dated a non-Hispanic. White men (48%) are about as likely as white women (43%) to have dated a nonwhite.
That general pattern holds when looking at the data in more detail -- black men are much more likely than black women to say they have dated whites, Hispanics, and Asians. Men of all racial and ethnic backgrounds are significantly more likely than women of all backgrounds to say they have dated an Asian.
Dating People of Various Racial and Ethnic Backgrounds, by Race and Gender
|
Dated a Non- |
Dated a |
Dated a |
Dated an |
|
|
% |
% |
% |
% |
|
|
|
|
|
|
|
|
All Americans |
85 |
34 |
36 |
18 |
|
Men |
88 |
34 |
38 |
28 |
|
Women |
83 |
34 |
34 |
9 |
|
|
|
|
|
|
|
All non-Hispanic whites |
97 |
24 |
29 |
18 |
|
White men |
99 |
25 |
30 |
27 |
|
White women |
96 |
24 |
28 |
9 |
|
|
|
|
|
|
|
All blacks |
44 |
95 |
28 |
12 |
|
Black men |
56 |
97 |
40 |
24 |
|
Black women |
35 |
94 |
18 |
3 |
|
|
|
|
|
|
|
All Hispanics |
64 |
34 |
83 |
19 |
|
Hispanic men |
69 |
39 |
86 |
31 |
|
Hispanic women |
60 |
29 |
81 |
8 |
Overall, blacks are much more likely to say they have dated a white (44%) than a Hispanic (28%) or an Asian (12%). Hispanics are twice as likely to say they have dated a white (64%) than a black (34%), and only 19% of Hispanics have dated an Asian. Whites are slightly more likely to say they have dated a Hispanic (29%) than a black (24%) or an Asian (18%).
Survey Methods
Results are based on telephone interviews with 2,264 national adults, aged 18 and older, conducted June 6-25, 2005, including oversamples of blacks and Hispanics that are weighted to reflect their proportions in the general population. For results based on the total sample of national adults, one can say with 95% confidence that the maximum margin of sampling error is ±5 percentage points.
Results for the sample of 807 non-Hispanic whites, aged 18 and older, are based on telephone interviews conducted June 6-25, 2005. For results based on the total sample, one can say with 95% confidence that the margin of sampling error is ±7 percentage points.
Results for the sample of 802 blacks, aged 18 and older, are based on telephone interviews conducted June 6-25, 2005. For results based on the total sample, one can say with 95% confidence that the margin of sampling error is ±5 percentage points.
Results for the sample of 511 Hispanics, aged 18 and older, are based on telephone interviews, conducted June 6-25, 2005. For results based on the total sample, one can say with 95% confidence that the margin of sampling error is ±5 percentage points. (181 out of the 511 interviews with Hispanics were conducted in Spanish.)
On a different topic,
Q.33-34 SPLIT SAMPLED
33. In general, would you say you approve or disapprove of a black man dating a white woman?
|
|
Approve |
Disapprove |
No opinion |
|
% |
% |
% |
|
|
Total |
|
|
|
|
2005 Jun 6-25 |
71 |
22 |
7 |
|
|
|
|
|
|
Non-Hispanic whites |
|
|
|
|
2005 Jun 6-25 |
65 |
26 |
9 |
|
|
|
|
|
|
Blacks |
|
|
|
|
2005 Jun 6-25 |
83 |
14 |
3 |
|
|
|
|
|
|
Hispanics |
|
|
|
|
2005 Jun 6-25 |
86 |
10 |
4 |
|
|
|
|
|
|
BASED ON 1,116 TOTAL ADULTS IN FORM A; ±7 PCT. PTS. |
|||
|
BASED ON 385 NON-HISPANIC WHITES IN FORM A; ±10 PCT. PTS. |
|||
|
BASED ON 394 BLACKS IN FORM A; ±7 PCT. PTS. |
|||
|
BASED ON 260 HISPANICS IN FORM A; ±8 PCT. PTS. |
|||
34. In general, would you say you approve or disapprove of a white man dating a black woman?
|
|
Approve |
Disapprove |
No opinion |
|
% |
% |
% |
|
|
Total |
|
|
|
|
2005 Jun 6-25 |
75 |
19 |
6 |
|
|
|
|
|
|
Non-Hispanic whites |
|
|
|
|
2005 Jun 6-25 |
72 |
23 |
5 |
|
|
|
|
|
|
Blacks |
|
|
|
|
2005 Jun 6-25 |
82 |
13 |
5 |
|
|
|
|
|
|
Hispanics |
|
|
|
|
2005 Jun 6-25 |
84 |
12 |
4 |
|
|
|
|
|
|
BASED ON 1,148 TOTAL ADULTS IN FORM B; ±7 PCT. PTS. |
|||
|
BASED ON 422 NON-HISPANIC WHITES IN FORM B; ±9 PCT. PTS. |
|||
|
BASED ON 408 BLACKS IN FORM B; ±7 PCT. PTS. |
|||
|
BASED ON 251 HISPANICS IN FORM B; ±8 PCT. PTS. |
|||
Finally, thinking back on your own experience,
41. For each of the following, please say whether you, personally, have dated someone of that race or ethnic background, or not. How about someone who was -- [RANDOM ORDER]?
A. White
|
|
Yes, have |
No, have not |
No opinion |
|
% |
% |
% |
|
|
Total |
|
|
|
|
2005 Jun 6-25 |
85 |
15 |
* |
|
|
|
|
|
|
Non-Hispanic whites |
|
|
|
|
2005 Jun 6-25 |
97 |
3 |
* |
|
|
|
|
|
|
Blacks |
|
|
|
|
2005 Jun 6-25 |
44 |
56 |
* |
|
|
|
|
|
|
Hispanics |
|
|
|
|
2005 Jun 6-25 |
64 |
36 |
* |
B. Black
|
|
Yes, have |
No, have not |
No opinion |
|
% |
% |
% |
|
|
Total |
|
|
|
|
2005 Jun 6-25 |
34 |
66 |
* |
|
|
|
|
|
|
Non-Hispanic whites |
|
|
|
|
2005 Jun 6-25 |
24 |
76 |
* |
|
|
|
|
|
|
Blacks |
|
|
|
|
2005 Jun 6-25 |
95 |
4 |
1 |
|
|
|
|
|
|
Hispanics |
|
|
|
|
2005 Jun 6-25 |
34 |
66 |
* |
C. Hispanic
|
|
Yes, have |
No, have not |
No opinion |
|
% |
% |
% |
|
|
Total |
|
|
|
|
2005 Jun 6-25 |
36 |
64 |
* |
|
|
|
|
|
|
Non-Hispanic whites |
|
|
|
|
2005 Jun 6-25 |
29 |
71 |
* |
|
|
|
|
|
|
Blacks |
|
|
|
|
2005 Jun 6-25 |
28 |
72 |
* |
|
|
|
|
|
|
Hispanics |
|
|
|
|
2005 Jun 6-25 |
83 |
16 |
1 |
D. Asian
|
|
Yes, have |
No, have not |
No opinion |
|
% |
% |
% |
|
|
Total |
|
|
|
|
2005 Jun 6-25 |
18 |
82 |
* |
|
|
|
|
|
|
Non-Hispanic whites |
|
|
|
|
2005 Jun 6-25 |
18 |
82 |
* |
|
|
|
|
|
|
Blacks |
|
|
|
|
2005 Jun 6-25 |
12 |
87 |
1 |
|
|
|
|
|
|
Hispanics |
|
|
|
|
2005 Jun 6-25 |
19 |
81 |
* |