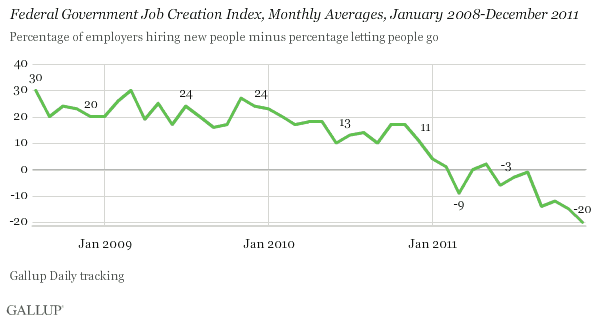
PRINCETON, NJ -- Job creation by the U.S. federal government fell further into negative territory in December 2011 with Gallup's Job Creation Index at -20, worsening from -15 in November and from -12 in October. While 23% of federal employees in December said their area was hiring, 43% said employees were being let go -- by far the most negative conditions Gallup has found since it began tracking federal government job creation in August 2008.

Gallup measures job creation by asking those who are employed whether their companies are hiring workers and expanding the size of their labor forces, not changing the size of their workforces, or laying off workers and reducing their workforces. Gallup's Job Creation Index is based on the net difference between the percentage who say their employer is hiring and those who say their employer is letting workers go.
Employees' negative views of job creation in the federal government represent a sharp change from previous years. Despite the recession and financial crisis of 2008-2009, federal government workers were reporting more hiring than firing until early 2011. Federal job creation fell to the single digits in January and has been generally negative since then, with more workers reporting firing than hiring since June.
State and Local Government Job Creation Declines Moderating
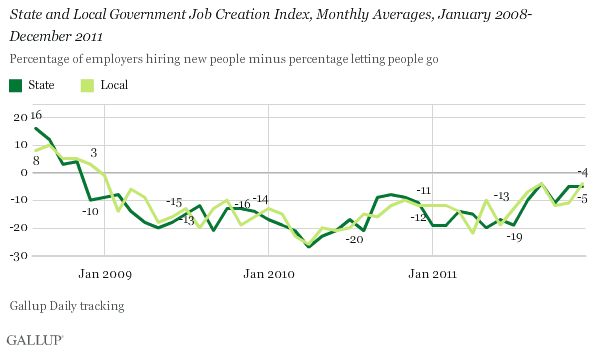
State and local government job creation also declined in December, with the state index at -5 and the local index at -4. State job creation began declining in December 2008 and local government job creation began its decline the following month. State and local governments have been shrinking their workforces since that point with the declines peaking in April 2010. At the end of each of the past two years, state and local workers have reported a modest improvement but still negative job creation.

State and local government job creation has been negative during recent years, even as the federal government and the private sector were producing new jobs. In late 2011, the job situation appears to have moderated at the state and local level, while the federal job situation continued to deteriorate.
Private-Sector Job Creation Shows Little Change
Nongovernment job creation was at +18 in December -- not much different from the prior two months and most of 2011. Private-sector job creation turned negative in December 2008 and remained that way through July 2009. Since that point, job creation has improved slowly and has been in the +16 to +20 range since February 2011.

Implications
Gallup's Job Creation Index shows major shifts in the hiring and firing patterns across federal, state, and local governments since 2008. Initially, in 2008, 2009, and 2010, the federal government was largely insulated from the job losses the private nongovernment sector and state and local governments were experiencing since the recession and financial crisis. That all changed in the past three months when federal government employees began to report lower job creation at their places of employment, while the picture moderated with less losses at state and local governments, and remained positive and stable for private-sector workers. Concerns about the rapidly expanding federal budget deficit may have begun to reverse the hiring in the federal government that went on after 9/11, particularly as the 2012 elections approach.
On a more positive note, the moderation of state and local government job losses may mean that these government entities are finally reaching a new equilibrium. That is, state and local government revenues may now be stabilizing at more sustainable levels. Whether this is the case is yet to be seen as state and local budgets are rolled out in 2012.
The best news may be about private-sector job creation. The current level of job creation tends to reinforce the idea that the private sector continues to produce jobs at a consistently moderate pace. Private-sector job creation is the key to overall economic growth. Private-sector job creation is also essential if those leaving government jobs at all levels are going to find new nongovernment employment opportunities.
Gallup.com reports results from these indexes in daily, weekly, and monthly averages and in Gallup.com stories. Complete trend data are always available to view and export in the following charts:
Daily: Employment, Economic Confidence and Job Creation, Consumer Spending
Weekly: Employment, Economic Confidence, Job Creation, Consumer Spending
Read more about Gallup's economic measures.
View our economic release schedule.
Survey Methods
For Gallup Daily tracking, Gallup interviews approximately 1,000 adults, aged 18 and older, each day the Gallup Job Creation Index results are based on a random sample of approximately 550 current full- and part-time employees each day.
National results for December are based on Gallup Daily tracking interviews with 14,313 employees. For this sample, one can say with 95% confidence that the maximum margin of sampling error is ±1 percentage point. Federal government, state, and local results for December are each based on interviews totaling more than 600 adults. For each of these samples, the maximum margin of sampling error is ±5 percentage points.
Interviews are conducted with respondents on landline telephones and cellular phones, with interviews conducted in Spanish for respondents who are primarily Spanish-speaking. Each sample includes a minimum quota of 400 cell phone respondents and 600 landline respondents per 1,000 national adults, with additional minimum quotas among landline respondents by region. Landline telephone numbers are chosen at random among listed telephone numbers. Cell phone numbers are selected using random-digit-dial methods. Landline respondents are chosen at random within each household on the basis of which member had the most recent birthday.
Samples are weighted by gender, age, race, Hispanic ethnicity, education, region, adults in the household, and phone status (cell phone only/landline only/both, cell phone mostly, and having an unlisted landline number). Demographic weighting targets are based on the March 2010 Current Population Survey figures for the aged 18 and older non-institutionalized population living in U.S. telephone households. All reported margins of sampling error include the computed design effects for weighting and sample design.
In addition to sampling error, question wording and practical difficulties in conducting surveys can introduce error or bias into the findings of public opinion polls.
For more details on Gallup's polling methodology, visit www.gallup.com.
